
It’s crazy to think that this is the third full week of April. I know that I am a broken record, but I can’t understand how quickly this year has gone. It’s no secret that the Charleston real estate market really picks up during the spring and this year has followed the same suit.
I wanted to share some of our market’s stats from March. Highlighting Charleston County and the neighborhoods that tend to be in the most demand, you’ll have a rough idea of what’s going on in the area. I love looking at stats from the month prior, I think it’s a great indicator of what’s to come in the market.
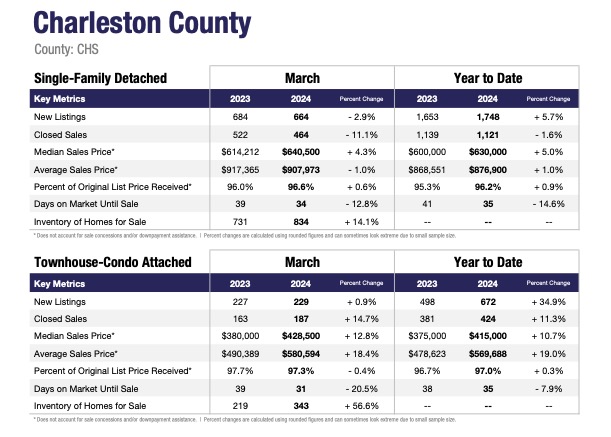
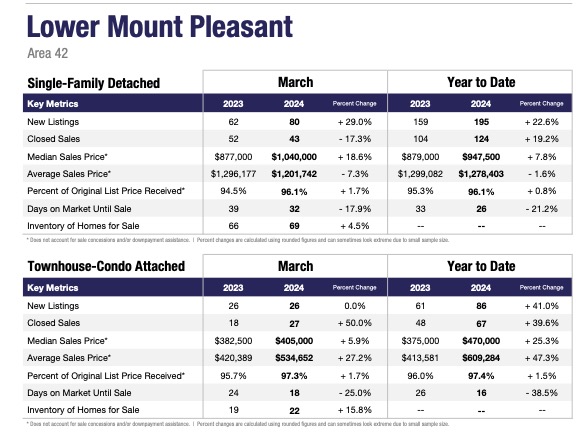
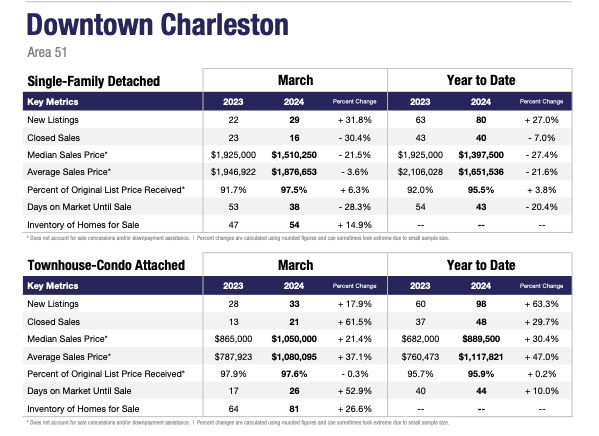
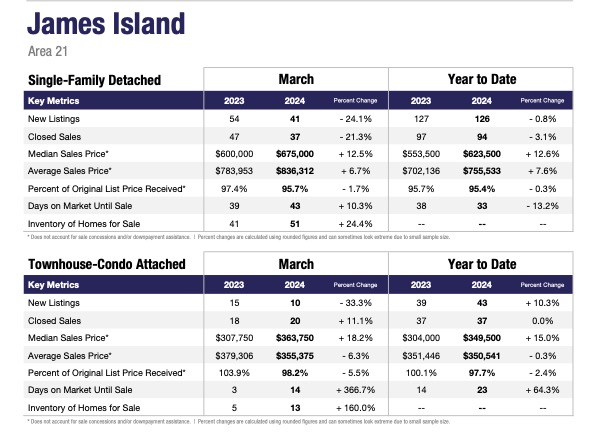
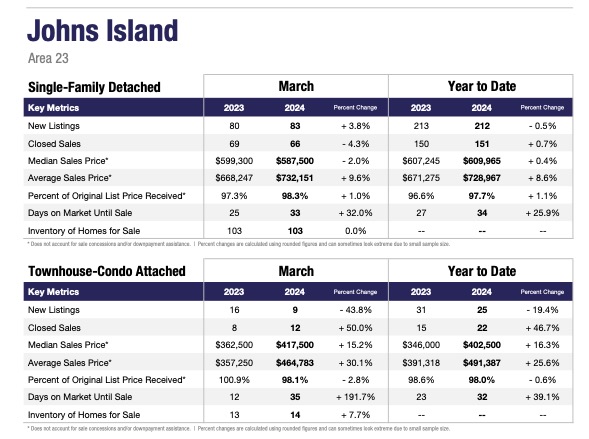
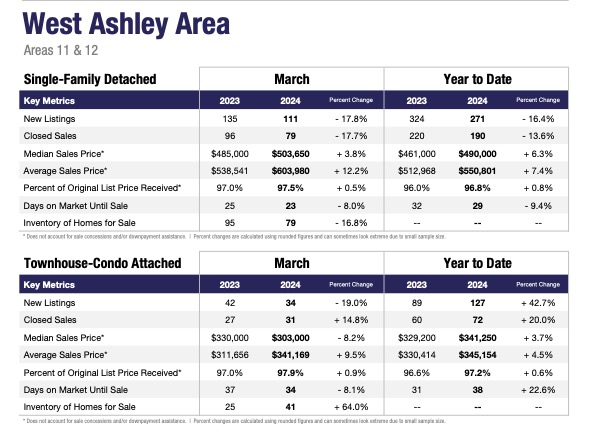
The graphs above show all of Charleston County. The next few show South Mt Pleasant (29464), downtown Charleston (29401 and 29403), James Island, Johns Island and all of West Ashley (29407 and 29414).
March (and April) can be weird months in terms of comparing this year to last year. Part of that is due to spring holidays and schedules that are rarely the same each year (Easter, spring breaks, The Masters). All of these events bring ebbs and flows between March and April, with both months being similar and fluid in terms of stats (in my opinion).
What other market stats do you want to see? I want to know!